Judging user comfort and waste#
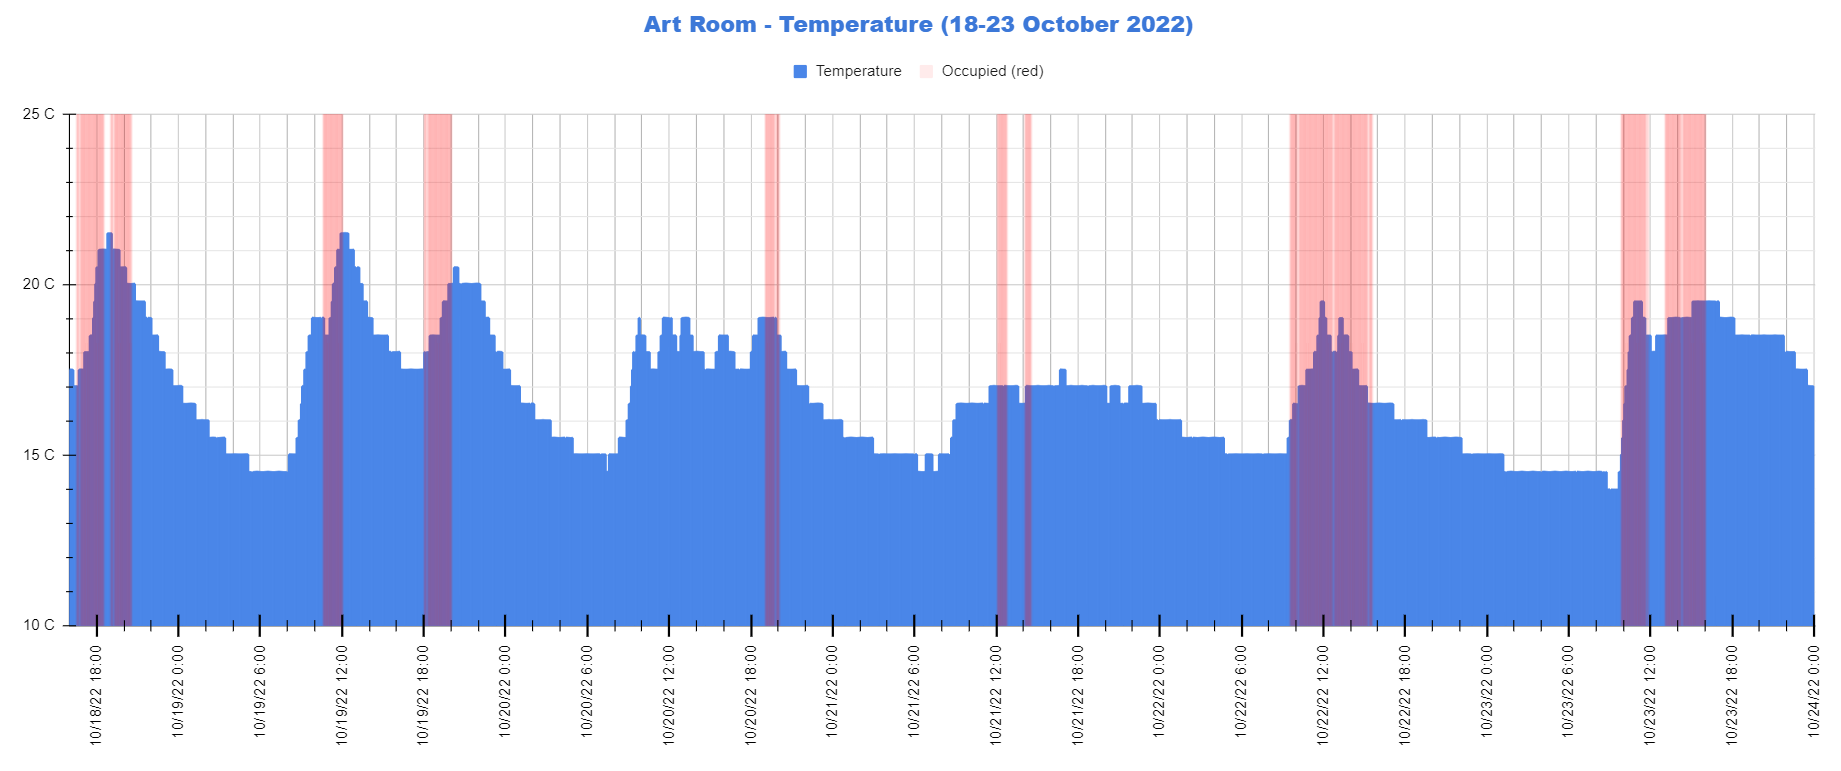
If you plot temperature data against when a space is occupied, you can get a sense of two things: whether the users are likely to be comfortable, and how much of your current heating is wasted.
In the ideal case, the heating will be brought to the correct temperature for that group exactly at the right time for groups to enter the space and between groups be allowed to drop back to the minimum temperature that’s safe for the building and its contents. The heating will also be held to within 1C either side of the set temperature, since people find big temperature variations uncomfortable.
Good optimised start control will get closer to the ideal case than a heating volunteer can manage. It’s very common for groups to be putting enough energy into the building to achieve the ideal, but not at the right times. If you think about the area under the ideal curve versus the area under the current curve, that gives a rough idea of how much energy is being wasted and may be able to calculate a payback period for a control change. Of course, you have to obey the laws of physics in thinking about the ideal curve - it does take time for the building to warm up. A building with low heat loss will retain heat well and not take long to warm. That’s why for venues that use space heating, addressing heat loss comes before big heating changes.
The relationship to draughts
In a big space, if the heating doesn’t reach the set point by the time the group enters, there’s an extra reason for users to be uncomfortable. Draughts are stronger and more chaotic while a space is warming up. Once the temperature reaches the set point, the buildng will be in steady state and the draughts will become predictable so users can at least try to avoid them!